Observability Suite
The Observability Suite is a set of .NET background services whose main job is to keep a constant pulse on pulsetv.com — the company's revenue-driving storefront. The suite continuously probes the public-facing website to confirm pages load, response times stay healthy, and a bad deploy or upstream issue surfaces before customers run into it. Two secondary checkers extend the same approach to the company's internal affiliate tracking platform and to the email campaign banner endpoints, so a broken tracking host or a missing banner ad gets flagged early.
Every probe exports its outcome as Prometheus metrics and OpenTelemetry traces: response-time histograms, success rates, and per-endpoint availability. The metrics feed dashboards and alerting so a regression — the storefront slowing down, a tracking host returning errors, an ad banner failing to load — goes out as a text alert to the team's phones rather than waiting on a support ticket.
Architecturally, all three services share a common shape: a hosted .NET Worker that owns the probe loop, structured logging into the company's log pipeline, and a clear separation between the probing logic and the metric/trace exporters so adding a new endpoint is a config change rather than a code change. Keeping the three services consistent — same shape, same metric names, same operational expectations — was an explicit design goal so operations can treat them as a single piece of infrastructure.
Screenshots
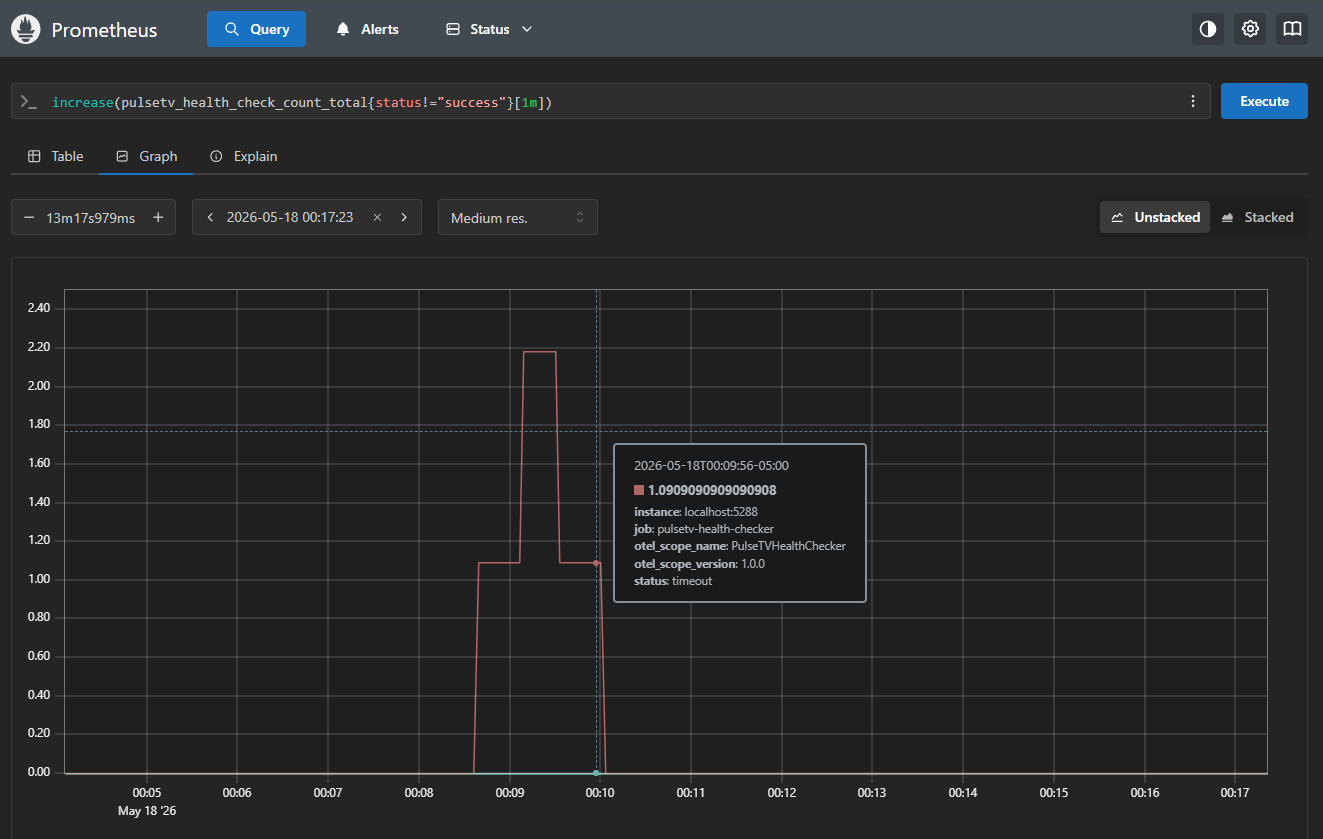
A live Prometheus query against the PulseTV health checker's metrics — the spike at 00:09 is the moment a real timeout was caught and a text alert went out to the team.